The UX Kanban

In some organizations, the user experience (UX) team is seen as a problem child. It has merits, brilliant minds and capable hands. But, it has its own ways of working.

In a typical services company, the UX team works in a horizontal mode – providing consultancy to every business unit. In product companies, the UX team may be divided according to the product portfolios. Regardless of size and nature of business, one thing is common that managing the UX team takes a toll on the CxOs of the organization. The pressures of billability, team members’ utilization and investment of tools are the commonplace problems. Of course, there is no panacea (the cure-all medicine) to these problems.

Many tools, methodologies have been attempted to “civilize” the team. One of them is Kanban.

Kanban literally means ‘signpost’, a just-in-time production system designed by Taiichi Ohno at Toyota. Kanban is a system to control the logistical chain from a production point of view, and is not an inventory control system.

In simple words, Kanban means to produce only when there is a demand. It helps organizations to be leaner, productive and have faster turnarounds. There is ample material available on the net to read and watch videos on Kanban system.

I took the Kanban approach and applied to the typical UX team scenarios. The first sketch shows a Kanban dashboard of projects in UX portfolio. It has visual cues and legends that helps the UX managers / leads to focus on what is important from delivery and sales point-of-view.

The overall view

The overall view

The second sketch depicts the Kanban system from the team and tools perspective – how many designers we need to hire, what tools we need to purchase.

The team and tools view

The team and tools view

The third sketch shows the Kanban cards the UX team members would receive as work queues. They will get a precise description of what needs to be delivered, how and when.

The UX delivery view

The UX delivery view

If you tie these three sketches together, it could lead you to a system of UX team management – a web tool or an iPad app (if you visualize). Who does not want some structure to the maverick team :)?

The travel bug

Raise your hand if you love to travel :). Both for work and pleasure.

Being a designer has taken me to new places like US, UK, Malaysia and India. I love to travel.

Its easy to travel in India, my native country. The modes of transport are easy to understand and arrange. Same is the case with UK – great country for public transit. Malaysia is good too. It is in US where I struggled with – by using public transit. The fault was entirely mine.

I was in California after a good gap of 7 years. I should have started driving the car in US by now. It was my second visit to the country, longer than the previous one. The right-to-left wheel transition was a bit baffling to me, initially. I tried driving once and then gave up the thought. I relied on friends to tag along in their cars on weekend outings and sometimes choosing the VTA trains to roam around.

Weekend agenda was simple – explore new places. The downside of using the public transit was time – a simple journey from San Jose (CA) to Gilroy (CA) is a 40 min drive. A public transit journey (combining train and bus) taken around 2 hrs.

Back then, we did not have smartphones. The iPhone was 1yr old. Google was touted to release its first Android device. There was no blazing internet on the phone that we have now. No question of maps on phone.  It was July 2008.

On one of the weekend trips back to home, I missed a bus. Me and my friend waited for the next bus to come, which did not arrive as per schedule. The printed bus time-table at the stop told a grim story of weekend bus gaps. There were relatively less number of buses plying on the roads on weekends.

I thought, we are in the one of the most advanced places on earth, i.e. California. How come we do not have any service / tool / application that helps me travel with public transport? Mobile apps were just beginning to appear on devices. What I was thinking as a concept was a mashup of public transit data, mobile phone capabilities and real time information.

In 2009, I sketched a concept – a public transit app that any tourist, or any city dweller can use to travel. The app is called ‘Ghumiyo’ – a slang in Hindi language, which translated means “travel”. Notice the template I used 🙂 – The Nexus One and the HTC Sense skin used as the Android launcher. 

Here is the app I designed:

Ghumiyo_1

Ghumiyo_1

Ghumiyo_2

Ghumiyo_2

Ghumiyo_3

Ghumiyo_3

Ghumiyo_4

Ghumiyo_4

Ghumiyo_5

Ghumiyo_5

Fast forward to today – I now live in Texas and I drive a car :).

Step 3) Create the user task matrix – PART 1

“I don’t know who I am!” screams Jason Bourne in the first installment of the Bourne series, who is struggling to recall his memories, forgotten his name and forgotten his identity.

We don’t go through the same circumstances as Bourne does :). Strange but true, we can have opinions about our friends and family members. But when it comes to defining your self, it is not an easy thing to do. There might be an inherent feeling about your abilities, your emotions and your actions, but we often rely on others to define our persona.

When I was at NID (National Institute of Design), the first semester involved many exercises centered around discovering me as a person – what I like & dislike, what are things I cherish the most, what are my escape routes, what do I value and don’t value, etc. Most of my student friends had given up these kinds of exercises – their argument was that they already know how they are as a person and there was little delight they were deriving from the exercises.

The faculty member presented us this rationale– unless you don’t know who you are, you will find it difficult to understand who / what/ why / how the other person is. The objective of those exercises was to probe deeper into yourself and understand the person you are – your background, your value system, your aspirations and perhaps your fears too.

If someone told you that are emotional person, take it in your stride. Perhaps that’s a compliment someone paid you, free of cost :).Being a designer you need that skill, to imbibe the world around you and come out with the best possible design.

As you may recall in our older posts, you can understand another person (i.e. a user of any product or service) by employing various techniques – observing the user, talking to the user, doing desk research, seeking opinions of the experts, etc. There are always different schools of thought – is it user-centered design or is it user-inspired design or is it user-assisted design or is it business-centered design? Very rarely will be products designed in a genius-driven mode, as Dan Saffer explains in his book “Designing For Interaction”.

Without getting into the debate – let’s stick to a stand: every product that is designed has users’ needs reference. Let’s not worry over the semantics.

Having a keen eye to capture context data (where the user works, how he works, what time he/she has lunch, etc.) will help you a lot. Examples of keen eye: Hope you recall the chase sequence in the movie ‘The Dark Knight’ where the Joker is aiming for Harvey Dent’s bulletproof car with a bazooka gun – the Joker is riding a trailer and he slides the trailer door to reveal something written in big typo on the door. It says “Slaughter is the best medicine” :). One who understands the psyche of the Joker has done a great job – the production designer.

One more example: The last minutes of the movie ‘Despicable Me’- the Minions are arranging the dance performance of Margo, Edith and Agnes. In a very short frame of time, you might notice the Blu ray player to be named as “Gru-ray player” :). An animator / designer who has imbibed the ‘ecosystem’ around him/her can only create this kind of work.

So you might have found out who you are, for some it’s still work-in-progress.

Ultimately, it is all about the discovery.

Step 2) Create the information architecture – PART 3

Let’s move away a bit, from the digital world.

What comes to your mind when you come across some daily displays of information, like these?
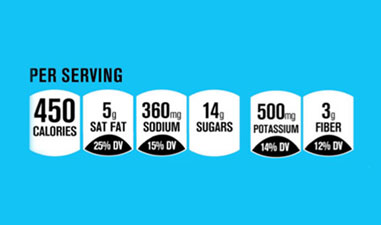
Nutrition Facts

Nutrition Facts

Nutrition Facts

Nutrition Facts

Pure data treatment, right? What can one do with this type of data presentation – is the nutritional information indicative enough to tell you what’s good for your health?

We need to dig more to make of sense of the data. How about these pictures?

Menu

Menu

Food Menu

Food Menu

Well, the data in these pictures are easy to read. Why? Because there are some “heads” that hold specific data. i.e. categories that classify the data into different buckets. The information that you deduce from the menu card is what type of restaurant it is (the variety of food it offers, the price range, whether it suits your next date :), etc.). Only when you step in the restaurant, eat the food and get out, you have ‘experienced’ the restaurant and you are knowledgeable to praise or rant the restaurant.

Every day you are exposed to vast amount of information. Crucial are also the circumstances / contexts in which you consume the information. And at that time, the entire onus of delivering the information rests on the designer :).

Imagine you are driving your car and you have a flat tire. Never in your life you have had flat tire (there is always the first time for everything :D) and never have you ever serviced your car before. So, human tendency is to pick up the phone and call service center. Self-starters will pick up the ‘car manual’ and put up the spare tire and drive back home. I am narrating a true story, not an inspired one :). One of my friends encountered the flat tire situation in US, he could not deduce how to change the tire from the car manual. He found out that the spare tire was smaller than the regular tire, he felt he was duped by the car seller :). Anyways, he got back to the car manual and could not change the tire. Here is what the car manual looked like:

Car Manual

Car Manual

If you are curious about what happened to the car, here it is what happened: I changed the spare tire of my friend’s car and we reached home safely. If the book was designed intuitively, my friend could have done the job on his own and won himself some credibility :).

The point is that every printed word that you come across may be uniquely represented – it conveys some meaning (in isolation or together with other words), is part of a big ‘category’ – a common bucket of words / data combined together to make some sense.

Information architecture is a structure that holds the data together.  It is a set of data elements that define the hierarchy of data (what data sits on the top, what at the next level and so on, image a tree structure). It is a structure that defines the relationships between the data – e.g. in an electronic store catalogue there will be list of individual items available for sale. The store may also display products that can be sold as “combo” with other products. Or products that were bought by customers after purchasing a product (“Customers who bought this also bought….”).

It is up to the designer to establish the relationships between the data. The designer visualizes the ecosystem, gets the user and stakeholder data – now he/she has to construct a ‘structure’ which will become the IA (that will translate user ‘needs’ to user journeys). This structure will help the end user to consume the content, ‘see’ what is available, and help him/her to reach specific information using controls offered by the design – e.g. on an e-commerce site, the user will use category-wise listing or search utility to find the desired product.

Information architecture alone does not solve the issue of non-intuitive interfaces. It is ONE of the elements that define the interface. The content, the visual treatment also play an important part in the overall design.

At this point, it will be good if you read the  ‘Elements of user experience’ created by Jesse James Garret. He explains the ‘elements’ in a better way – the different stages that make up the entire user experience aspect of any digital product. In this representation, you will find information architecture placed at the center of the system, a third step from surface to strategy.

So all said and done, how does one actually create information architecture?

Let’s do that in our next and final post on IA.

Step 1) Understand the ecosystem – PART 1

Regardless of the steps involved in creating the paper prototypes, an important point to understand is that one has to think visually. We are taught to think in a structured way, question and get answers in a logical way, conditioned to rationalize everything. That’s good. But you have to use imagination too – things that may defy the conventions and make you connect the dots. It’s okay if there are some things that remain unexplained, things that you cannot make connections with. Like all mysterious things, let the discovery awe you in the design process, while designing the product / service. You are not going to get all the answers at one go.

Whenever in doubt, bank upon your imagination and visualize those aspects that make things ‘believable’. When you understand the ecosystem, knowledge is as important as imagination.

Ecosystem could be a vast sea and probably you might be designing a very small yet significant part of it. E.g. In a financial institution like Citibank or HSBC, your design goal could be to optimize the online self-help documentation that will minimize the helpdesk telephone calls (eventually reducing the cost to the company). If you are new to finance domain, you are lucky. You could be in a position to imbibe the best knowledge of the finance world and design solution accordingly.

User experience designers often say that they design technology-agnostic and domain-agnostic solutions, i.e. whether is a life science project or a telecom project or any educational project, their design process & deliverables will remain the same. Regardless of the organization & the market segment, they work ‘horizontally’. However, there is no harm in being a little vertical about the domain. Having deeper insights about technology, undefined rules, sensing the interplay between different stakeholders will always help you.  We call this horizontal and vertical approach as the “T” approach – the alphabet signifying the horizontal direction designer undertakes project-wise (across all departments of the organization) and the vertical direction signifies the direction designer seeks domain-wise (deep probing a specific area). Team up with a systems engineer, a marketing expert, or corporate communications or public relations manager and get those great insights.

This T-approach will help you understand the ecosystem. Understanding is not just asking questions to stakeholders and users. Nor it is just about doing contextual inquiries of the users. It is also about sensing things. It is not reading and deducing the written material. It is also about ‘reading between the lines’. A designer already has the gift to imbibe things, a keen eye and attentive ear, an imaginative mind and visual thinking. To understand the ecosystem is to commission all the senses and orchestrate the data, information and the insights that one gathers from all the customer touch-points.

Remember Sherlock Holmes? Have you read ‘Tinker Tailor Soldier Spy’? Have you seen the Jason Bourne trilogy of movies? Its all the detective and spy stuff, which might excite one – all the protagonists of these fictions think and act differently. Their ‘view’ of the problem at hand and the ecosystem is what makes them successful.

So what is actually an ecosystem? It is the designer’s view of how he/she looks at the things that influence the design. This will tell the designer how certain things work. Who makes them work? What happens if a certain parameter is missed out? What will happen if the output is overshot? Will users abandon the ship if a certain task is vaguely defined?

There are many questions that one comes across in designer’s mind. As discussed earlier, there might be answers to few. For unanswered questions, it’s good to use your imagination. Some questions might be answered during the later stages of design (prototype iterations or user testing).

As a designer, you either facilitate or make a disruptive change to the system with your designs. Most designers take the pleasure in breaking the system by being in the system. That’s what ‘T-approach’ is all about.

In the next post, let’s look at some examples of mind-maps that define the ecosystem.